What Can You Trust if You Can’t Trust Statistics?
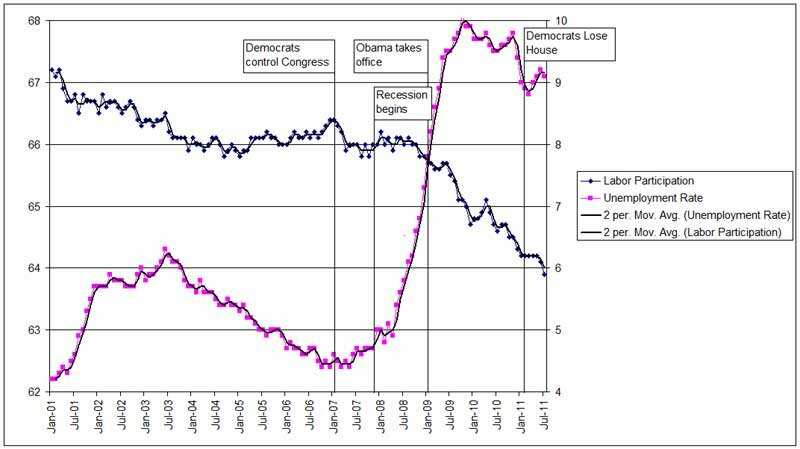
Chad the Pirate-King pointed out some statistics to me over the weekend. He noticed that when he plotted the several important milestones for the Democrats against the labor participation rate, what was good for the Democrats was bad for the participation rate. See chart below.
This chart will affirm everything that Republicans believe about Democratic leadership. Democrats will retort that statistics can be twisted to support any point of view and that I’m already on record as being biased against them. This is true.
But other things struck me with this chart.
Note that until July 2008 the labor participation rate was gradually drifting downward – about a full point over 7 1/2 years after the labor rate peaked in 2001 (chart below). So during the “good times” of the Bush presidency, times that weren’t so good in the 2001-02 recession, people were leaving the labor force. Why?

Another observation of the chart is the trough of low unemployment roughly between July 2003 and July 2008. While unemployment varied two points during that time, the labor participation rate fluctuated only half a point. So if unemployment was falling, where were the people coming to fill the jobs?
Similarly when the recession took hold, after the Democrats took control of all three branches of federal government (and a majority of governorships and state legislatures too), the labor participation rate falls and unemployment rises. This makes sense since people who are out of a job aren’t laboring in the economy. But then something odd happens in October 2009: the unemployment rate begins to fall along with the labor participation rate.
The most obvious reason would be those whose unemployment benefits have expired are dropped from the unemployment statistic. If they were included the rate would be 14-17% according to my quick analysis in Excel, meaning that there are a whole lot of people above that wiggly unemployment line that started 2 years ago. That’s roughly 50-90% more than the current unemployment rate is reporting. That’s a lot of people to officially ignore.
Which begs the question: Are they being ignored for political reasons? An unemployment rate of 14-17% hasn’t been seen since Franklin Delano Roosevelt was in office in 1940. While FDR is a progressive icon, the unemployment during his administration is the type of memory progressives like to forget. And it’s easy enough to play with the statistics to get them to say what you want them to say: simply write-off millions as having given up on the job search and presto! an unemployment rate that’s a quarter to half of what it would have been otherwise.
A similar rewrite of the inflation statistics has accomplished the same thing when it comes to prices. Anyone who buys their own food and gas knows that prices have noticeably risen over the past year – yet according to the BLS inflation is running at 3.6%. So either consumers are extremely perceptive to notice a 3.6% increase or the Universe the BLS calculates the CPI in is NOT the same one most consumers inhabit. The price rises I have seen, such as the 25% increase in the price of generic shredded cheese in a fortnight, remind me of the inflation of the 1970s. As it should. The BLS changed the way it calculated the CPI with the result that today’s CPI is artificially lower than it would be if it was calculated using the methodology employed in the 1970s. This makes historical comparisons much harder to make, and provides plausible deniability to those in power. The BLS has only one master to serve, and for the past five years that master – Congress – has been controlled by Democrats.
So if the average person can’t trust statistics, what can they trust? Well, they can trust their own experience. I do all the grocery shopping and the majority of major purchases in our house, and prices have been definitely rising a lot faster than 3.6%. Unemployment is 9.6%, yet I know of several friends and family members who are unemployed including three that are no longer counted as such because they “gave up looking for work” according to the BLS (which is BS according to them.)
Another independent barometer is the price of gold. Gold is at levels not seen since Reagan took office. It is still off its high in current dollars ($2,400/oz) but it is on track to reach it in six months. A government bureaucrat can’t change its price by simply changing the way a troy ounce is calculated – although I’m sure someone would like to try. Gold has always been an indicator of trouble. When gold rises, something is hitting the fan and it’s not hot-air coming out of Washington.
For the past three years we have been living through a very tumultuous time in our history. Although the current Chinese high-handed rhetoric towards Europe and especially the US is overstated (China is a parasite on the world economy; if the host weakens, so does the parasite), it got one thing right: living in interesting times is indeed a curse.

Leave a comment